FTC disclaimer: This post contains affiliate links and I will be compensated if you make a purchase after clicking on my link.
When your computer is connected to a network, it may face a disconnection issue or fail to transfer data.
There could be the possibility of data packets not reaching the destination, or the connection has not been established successfully.
Traceroute helps to analyze possible reasons behind any disconnection issues.
You can analyze the exact route your data packets are following to reach the destination.
Before this, you need to know how Traceroute works and the factors needed to be analyzed.
Most of the time, you will experience latency or unreachable problems.
Let’s learn how to use Traceroute to fix the problem.
What is Traceroute?
Traceroute is a network diagnostic tool that measures the speed and traces its route to reach the destination server.
The whole process of Traceroute starts by sending the test data packets to a specified destination address.
It also traces the intermediate routers or hosts in between the route.
Each router or computer that was encountered in a route is called hop or node.
What are the objectives of Traceroute?
The Traceroute has three prime objectives:
- Trace the path it takes for your packets to reach the destination
- Resolve the domain name or IP address of the routers or computers within the path
- Measures the time taken to reach each hop in a path.
Traceroute uses Internet Control Message Protocol (ICMP) to send data packets, and the number of hops in a path is measured in TTL (Time to Live).
How can Traceroute help?
Traceroute tool is used in diagnosing network problems, such as the speed it takes to reach the destination.
For instance, if you want to diagnose your broadband speed or solve the issue of not reaching a particular site, then Traceroute utility would help troubleshoot the problem.
Similarly, if you are a website administrator and want to verify how long it takes to reach your website, Traceroute will examine its path and figure out how much time it takes to reach each hop.
How Traceroute works?
The working of Traceroute can be understood in two different ways: Conceptually and technically.
Conceptual understanding of Traceroute.
Whenever you type in any website in your browser, it will try to connect to a website.
While establishing a connection, it will travel a path between your computer and website server.
It will come across several points in a path or say dots that make the route possible.
So, any problem at any point on the path will disconnect you from that website.
The first point starts from your router, situated in your home or office, and then it further reaches your ISP (Internet service provider).
It will take the main route from ISP ( the Internet Highway), reach the website’s local network, and finally to its web server.
Here, the Traceroute tool will scan the complete router path it takes to reach the destination and note down all points it encounters while traversing the path.
It also measures the time it takes to reach one point to another point.
If the Traceroute detects any connection problem or latency issue, it will display in the result.
It makes things easier to identify at each stop point along the route and detects the issue that is creating the problem.
Technical understanding of Traceroute
Before we move to the technical understanding of Traceroute, let’s understand some basic terms.
What is Hops?
Hops are the number of devices or routers or computers in between the source and destination.
All the points or stops along the path of the router are the path hops.
What is TTL?
The TTL (Time To Live) is the maximum hops covered during data packets transmitted from source to destination.
TTL should not be confused with the time in seconds because it has nothing to do with time.
Moreover, the TTL also clarifies that if data packets have to cover more than the default maximum hops, they will be discarded.
You may think, what then is the use of TTL in the Traceroute process?
If we do not specify the TTL, then the data packets will assume all the hops between the source and destination.
And, if the destination was not found, the data packets will keep traveling non-stop.
So, the purpose of TTL is to keep track of the number of hops in a path.
It will keep subtracting from the allowed maximum hops till it reaches 0.
Once it reaches the maximum allowed hops or the point, it will stop going further.
Subsequently, it will drop the packet and send the source with a message “TTL value exceeded, and it cannot forward the data packets further.”
How do Traceroute works?
When packets travel from source to destination, TTL defines the maximum number of hops it can cover before they are discarded.
The TTL value is mentioned in the IP header, and its value changes every time the packets reach the single hop between the routes.
It keeps adding plus 1 (one) to the IP header till it reaches the destination.
Also, it decreases the value of the maximum hop by one till it reaches the value zero.
So, this is the way to keep track of the number of hops achieved in a route.
Additionally, when the packets reach the maximum TTL value, the last hop in the line will send the message back to the source, “ICMP TTL Exceeded.”
The “ICMP TTL Exceeded” displays important information such as the total time it took to reach the last hop and how many hops are working.
Which one to use: Tracert or Traceroute?
Tracert and Traceroute commands’ objective are the same, but the main difference is that Tracert is used for the Windows operating system and Traceroute for Linux operating system.
The implementation of both Tracert and Traceroute commands are different, but the output is the same.
Both the commands display the complete route and the time it takes to reach each hop. It will also reflect if any packets are discarded.
You can use the “Traceroute” command in Unix, Linux, and Mac OS while the “Tracert” command is applicable only in Windows OS.
How to run Trace Route on Windows, Linux, and Mac OS?
Trace Route commands’ syntax would be different for different OS, but the functionality would be the same.
If you want to know how to run Trace Route commands in different OS, follow the instruction below.
How to run Tracert command on Windows OS?
The Trace Route commands are applicable in all Windows operating systems such as Windows 10, 8, 8.1, 7, etc.
Start Command Prompt in Windows
You need to start “Command Prompt” by pressing Win key + R and then type in “CMD” and hit Enter.
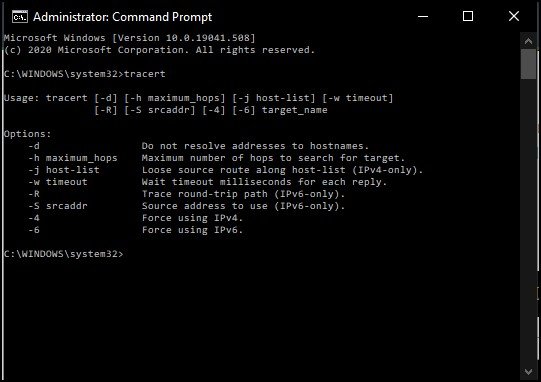
Now, type in “Tracert” and hit enter. It will display the complete command syntax and the available options
tracert [-d] [-h maximum_hops] [-j host-list] [-w timeout] [-R] [-S srcaddr] [-4] [-6] target_name
tracert target_name
target_name is the mandatory option which specifies the destination hostname or IP address.
But, other options in the command are optional.
Let’s learn what these options mean.
-d = It will not resolve IP addresses to hostnames, which makes the whole process quicker.
-h maximum_hops = Maximum hops defines the number of hops it will take to reach the destination.
If you don’t specify the maximum hops, the system will automatically take the default value 30 for Windows OS.
-j host-list = It uses the Loose Source Route option in the IP header along with the set of the intermediate destinations specified in the host-list.
The Loose Source Route specifies the routing information used by the gateway to forward the datagram to the destination.
-w timeout = It specifies the time (in milliseconds) required to get the reply.
-R = It will trace the round-trip path (applicable in IPv6 address only).
-S srcaddr = It indicates the source address (works only for IPv6 address).
-4 = It indicates that it will look for IPv4 address only.
-6 = It will look for IPv6 addresses only.
Tracert command with example
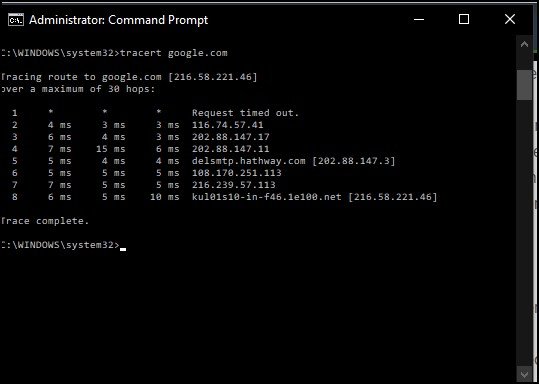
Type Traceroute command with the hostname. For instance, you can type in.”tracert google.com”
How to use the Traceroute command in the Linux Operating system?
You can use the “Traceroute” command for Linux OS, such as Ubuntu, Red Hat, Debian, etc.
Start the terminal and type the command.
You can start the terminal by pressing Ctrl + Alt + T and then type in “terminal” in the search bar.
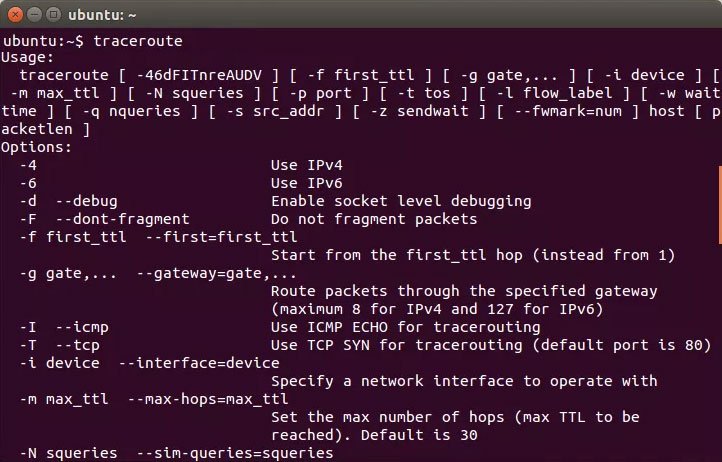
In a terminal, type in.”traceroute” along with hostname or IP address.
If you have not installed traceroute previously, install it using the command.”sudo apt-get install traceroute“.
Traceroute command syntax and the available option in Linux
traceroute [-dFInrvx] [-f first_ttl] [-g gateway] [-i iface] [-m max_ttl]
[-p port] [-q nqueries] [-s src_addr] [-t tos] [-w waittime] [-z pausemsecs] host [packetlen]
- -help – It is used to display a help message and exit.
- -4, -6 – It will explicitly force IPv4 or IPv6 tracerouting.
- -f – It will set the initial TTL on the first outgoing packet.
- -F – It sets the “don’t fragment” bit.
- -d – It will enable debugging.
- -g – It specifies a loose source route gateway (8 maximum).
- -i – It will set a network interface to obtain the source IP address.
- -I – To use ICMP ECHO.
- -m – To set the maximum TTL used in outgoing packets. The default is set at 30 hops.
- -n – It will print hop addresses numerically.
- -p – You can use it for UDP tracing. It specifies the destination port base. This option is mainly used to find unused ports.
- -r – To avoid the normal routing tables and send them directly to a host on a specific network.
- -s – It can choose an alternative source address. Note: you must select the address of one of the interfaces.
- -t – Defines the type of service. The value must be a decimal integer in the range from 0 to 255. You can use it to check if a different type-of-service result in different paths.
- -v – The verbose output.
- -w – It will set the time to wait for a response. The default value is 5 seconds.
- -z – It will set the time in milliseconds to pause between tests.
How to run Traceroute command on Mac OS?
To run a Traceroute command in Mac OS, you have first to open a terminal.
To open a terminal, you have to first go to “Application” and then “Utilities.” After that, click on “Terminal” and then in terminal type in “Traceroute” along with the target.
traceroute target (IP address or domain name)
How to read Traceroute command?
To understand the Traceroute command output, let’s understand the below traceroute output sample.
C:\WINDOWS\system32>tracert digitalmediaglobe.com
Tracing route to digitalmediaglobe.com [172.67.134.28]
over a maximum of 30 hops:
1 * * * Request timed out.
2 4 ms 4 ms 3 ms 116.74.57.41
3 4 ms 4 ms 5 ms 202.88.147.17
4 7 ms 5 ms 4 ms 136.232.22.201.static.jio.com [136.232.22.201]
5 * * * Request timed out.
6 * * * Request timed out.
7 38 ms 38 ms 38 ms 103.198.140.174
8 142 ms 143 ms 143 ms 103.198.140.107
9 145 ms 145 ms 145 ms 103.198.140.27
10 153 ms 153 ms 183 ms 103.198.140.107
11 144 ms 144 ms 144 ms 162.158.20.254
12 155 ms 154 ms 155 ms 172.67.134.28
Trace complete.
As you can see in the report, each row has multiple columns, where each row represents “hop” along the route.
9 145 ms 145 ms 145 ms 103.198.140.27
There are mainly five columns in each row. The first column represents the “hop,” and the second, third, and fourth columns (145ms, 145ms, 145ms) display the time it takes to reach this hop from another hop.
And the last column displays the IP address or domain name of the routers or computers, which came across the route.
Let’s look into some of the factors that need to be analyzed from the above results.
Checking the time between two hops
Time is a crucial factor while we analyze the above results. We need to understand the pattern it takes from the start to the end.
If the whole report indicates consistency in timing, it is a positive sign.
Even if one of the hops shows consistent latency, we cannot figure out any issue.
On average, the round trip time of more than 150 ms is considered not that great. If some hops show a big difference in round trip timing, then there could be an issue you need to consider.
Increase of latency
If there is a sudden increase in latency as we move towards the destination, there could be a problem on that hop from where the latency has increased.
It may lead to packet loss, which can be identified with asterisks (*) sign.
If the middle section of the report shows a consistent high latency, but if the hops’ beginning and end don’t show any changes, we cannot conclude anything from this result.
But, if we find high latency at the beginning of the report, there could be a local network problem.
You need to verify the connection issue with the local network administrator.
Timeout problem
If the beginning of the report shows a timeout problem, but the rest of the hops don’t have issues, consider it perfectly normal.
It indicates that the connected device with the hops at the beginning of the report doesn’t respond to the Traceroute command.
But, if you see any timeout problem at the end of the report, there could be a possibility of multiple issues.
It may be possible that firewalls would be blocking the request, or the return path may have an issue with the destination point.
You can also conclude that there could be a connection problem at the target point, which needs to be rectified.


