FTC disclaimer: This post contains affiliate links and I will be compensated if you make a purchase after clicking on my link.
It’s an indisputable fact that images are processed in the brain faster than words. Hence infographic came into existence which transforms complex information into graphics that are both easy to grasp and visually appealing. No wonder it will increase your web views and your visitors love it.
Before creating something beautiful and instantly understandable in Photoshop is often beyond the limits that time allows. So, to speed up the process quick and clean infographic tools comes into existence which won’t cost you a penny. We have hand picked infographics tools for your social media and blogs.
9 Free Infographic Tools for Social Media and Blogs
Easel.ly
Easel.ly is web-based free infographic tools that offers dozen of free templates called “Vhemes” to give a kick start to your infographic. It is easily customizable by visiting the library section with lots of tools and style. Like arrows, shapes and connector lines give shape to infographic and fonts, colors, and sizes to give style to your infographic. You can even upload your graphics and position them with one touch.
Infogr.am
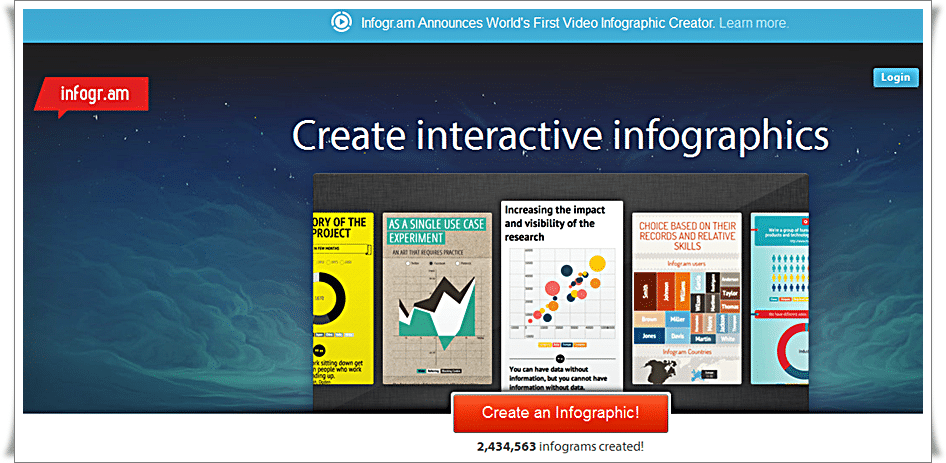
Infogr.am is one of the best infographic tools which helps to create cool infographics by giving access to a wide variety of charts, graphs and maps. You can change the look and feel of infographic by uploading pictures and videos and, you can represent your data perfectly by editing spreadsheet.
Infogr.am is a build-in spreadsheet editor which facilitates easy data editing tool and allow you to import XLS and CSV files. Other great features of Infogr.am is its ability to download your created files in PNG or PDF format. When you are done with your infographic, publish it directly from Infogr.am or embed it into your website or even you can share it with social media.
Visual.ly
Visual.ly is a community platform which allows you to create infographics and get them to share on social media. Visual.ly community, having more than 35,ooo designers to match your brand innovatively
Piktochart
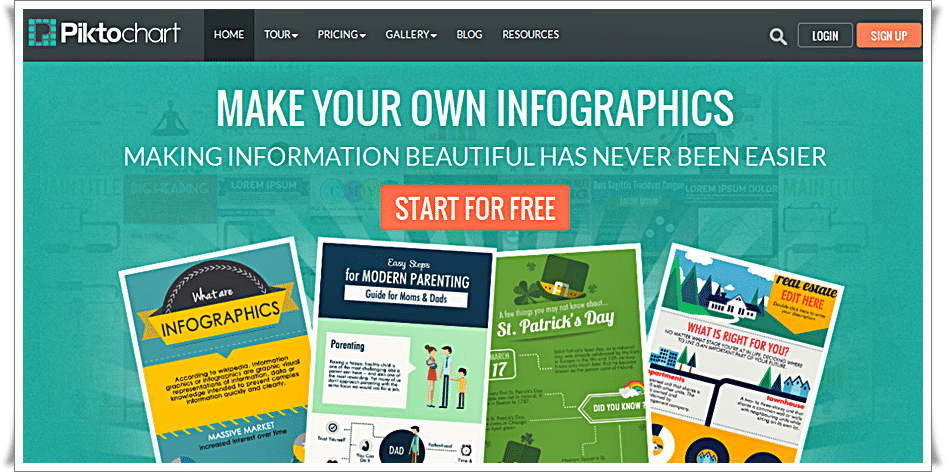
Piktochart is both an infographic creation tools and presentation tool that has an ability to create engaging infographics with just a few clicks. The Piktochart editor tool helps you to modify color schemes and fonts, upload basic shapes and images and even you can insert pre-loaded graphics. Its inbuilt grid, lined templates make it easy to resize images proportionally and align graphical elements.
Piktochart having both free and paid versions, while pro account costs $29 per month or $169 for a year. The free version has seven themes and does not require a credit card for registration. But if you decided to upgrade, the paid version offers thousands of highly creative themes.
Google chart – Google Developers
Have you tried Google chart? Google chart tools are more powerful, simple to use and available free of charge. You can choose from a vast variety of charts such as pie charts, column charts, timelines, line charts, area charts and many more. The advantage of Google chart is that it is user-friendly, customizable, perfectly match the look and feel of your website. Currently, Google Developer is the perfect infographic generator and experts in their own field. If you have a creative mind, the ugly looking information will be more pleasant and attractive to the eye.
Venngage
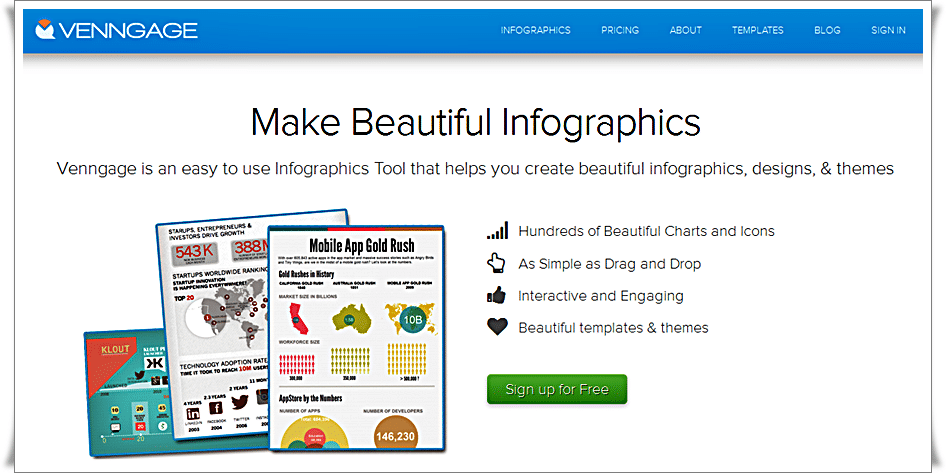
Venngage is an easy to use infographic design tools that helps you create beautiful infographics, designs, and themes. Venngage contains hundred of charts, vast library of pictograms and icons for your infographic. You can even customize color, size, style and theme easily to suit your brand. It contains simple drag and drop method to give the visual effect to your canvas and be an infographic design Rockstar in minutes. You can engage your viewer with interactive charts, place call to action widgets such as buttons, links, coupons and embed anywhere.
Tableau Public
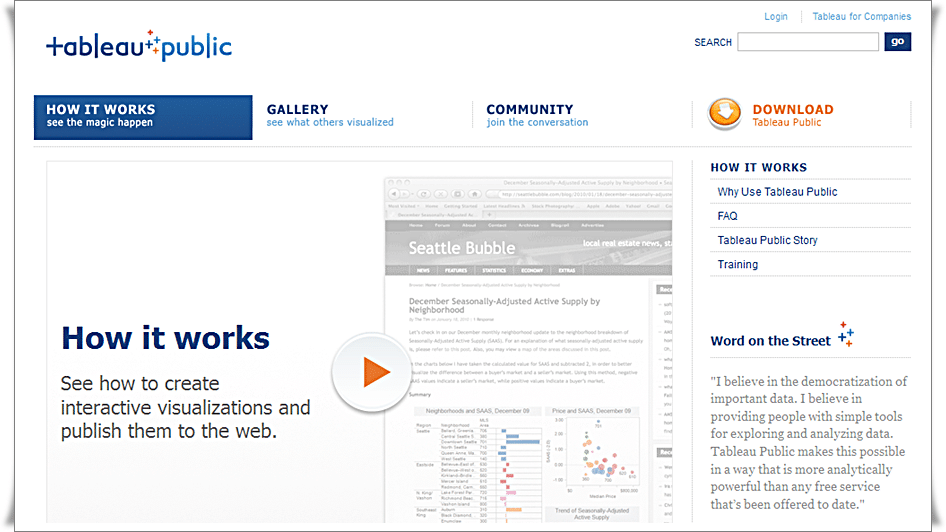
Tableau public is a free infographics tools that brings data to life, easy to use infographic tool and spectacularly powerful. Tableau public is not a web-based infographic maker instead you have to download a infographics software. So, you have not to rely on the internet for data visualization. You can simply upload a spreadsheet or csv and create a variety of interactive infographics, including data visualization and heat maps. It contains Venn diagrams to display association, bar charts, line graphs, density by location and many others.
Visualize
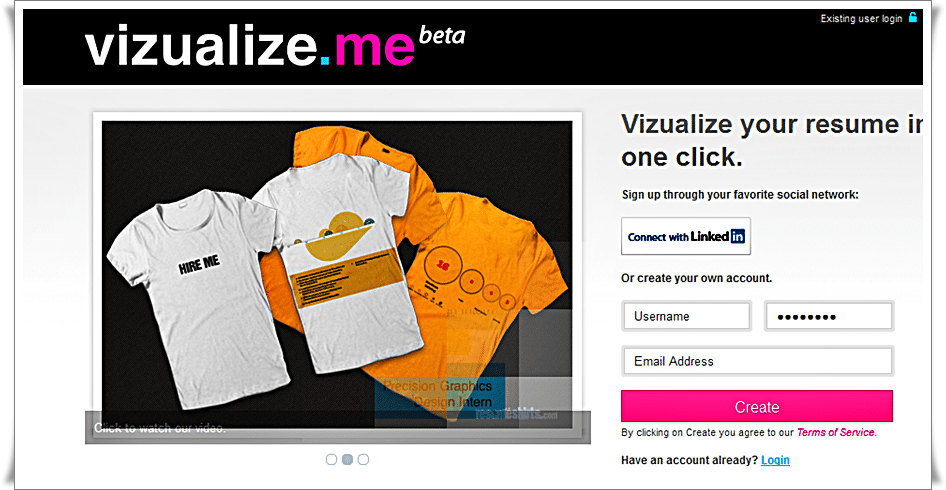
Visualize is a perfect infographic resume generator which not only make your professional accomplishment simple but compelling personal visualization. It is very simple to operate with one click and easily customizable for a better look. You can dig more and even take a look at previous examples for more creative ideas
Many Eyes
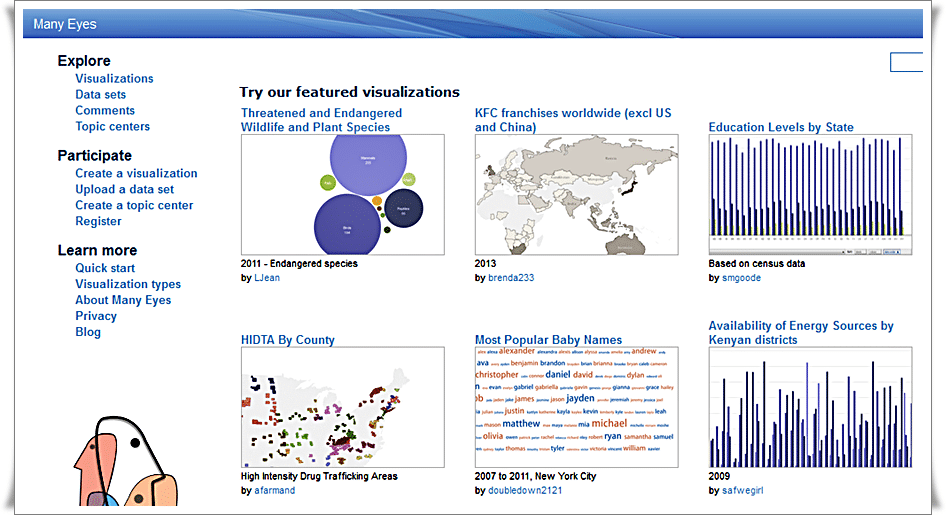
Many Eyes are another interesting infograhic maker launched by IBM Research and the IBM Cognos software group. Many Eyes provides a quick visualization and deep insight of your data. Many Eyes infographic makers comprehend your data, manipulate it and give visualization effect. Many Eyes web communities connect infographic experts and enthusiasts who share their expertise. It generally connects with three step process by uploading your data set, select your theme, add your data to visualization to form new infographic
Are you using any other infographic tools that you find it would be useful and different off the list? Please do comment below so that others will take benefit of it. Thanks for your patience!


